7 Figures intro
This chapter shows a few simple examples of including figures and getting cross-referencing to work across formats (HTML, Word, PDF).
7.1 ggplot2
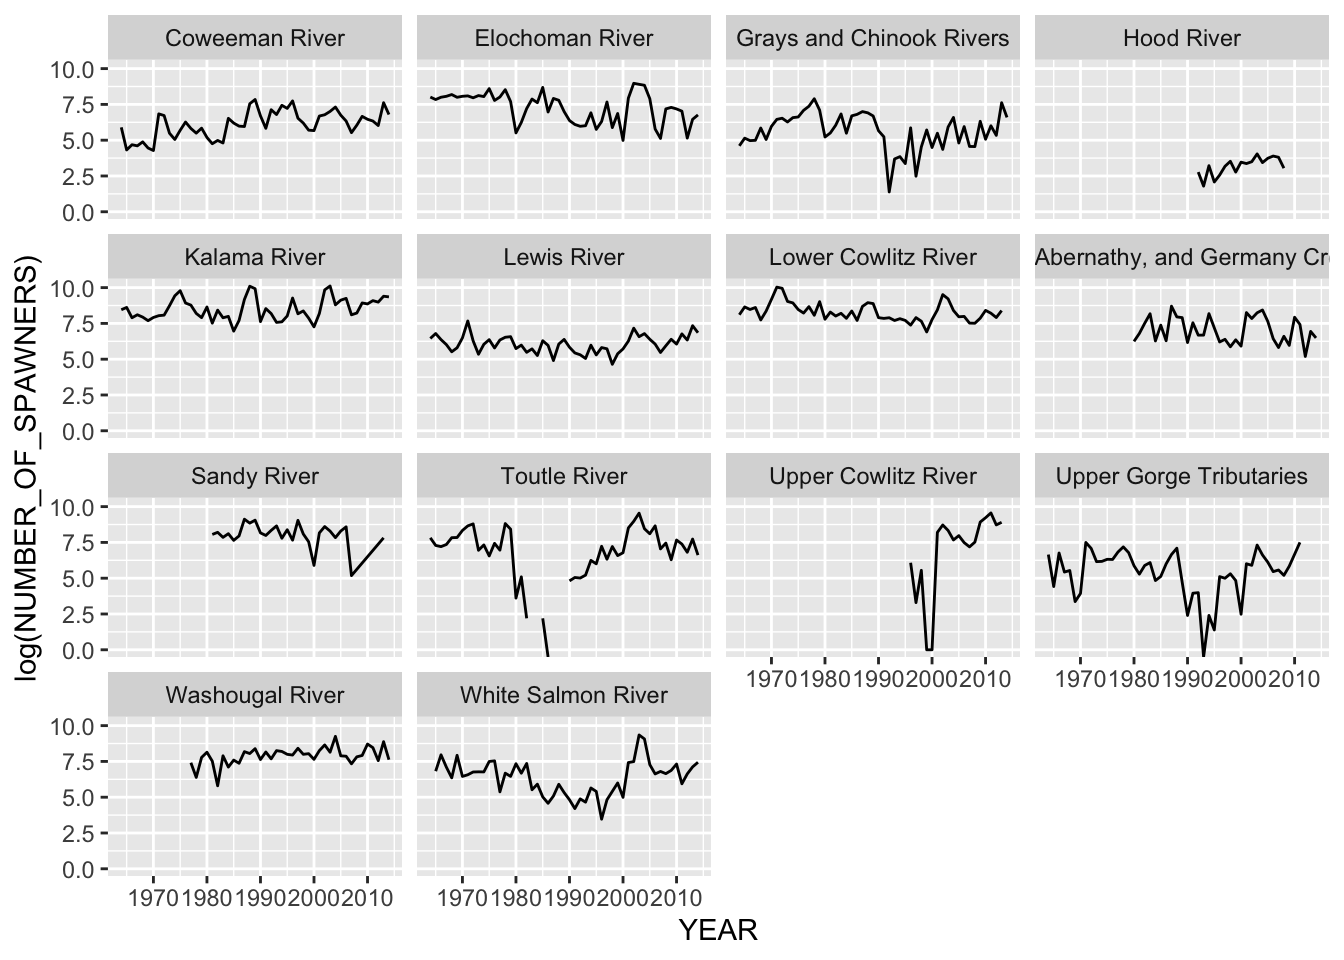
We can see in Figure 7.1 that there are many time series. The number of panels is choosen automatically using {ggplot2}.