3 Lower Columbia Chinook
Lorem ipsum dolor sit amet, consectetur adipiscing elit. Clark (1993) vitae ante quis dui egestas fringilla ac vitae justo (Ansley and Davis 1981; Collins et al. 1996; Deuel and Clark 1968) . Pellentesque quis magna vel odio malesuada rutrum a volutpat nisl. Aliquam fermentum, urna eget tristique mattis, augue augue tristique ipsum, eget finibus nunc eros non nisi. Phasellus mattis hendrerit sapien, quis accumsan dui pretium eget. Nunc eleifend laoreet urna a luctus. Nulla vel sapien in nulla gravida tempus sit amet a metus. Vivamus porta condimentum tempus. Maecenas rhoncus elit id ultricies scelerisque. In gravida urna in ligula fringilla euismod. Curabitur efficitur porta libero ac fermentum. Cras fringilla et libero at posuere. Curabitur sodales dapibus elit a convallis.
Morbi iaculis eget augue eget facilisis. Etiam non orci dignissim, efficitur purus viverra, pellentesque neque. Aliquam ornare, magna ut dictum mollis, nunc lorem iaculis nibh, eu consequat lectus urna euismod tortor. Etiam ut felis nisl. Nunc quis euismod felis. Vestibulum gravida nisi mi, quis mollis velit ullamcorper non. Aliquam tempus fringilla bibendum. Lorem ipsum dolor sit amet, consectetur adipiscing elit. Fusce viverra nulla elementum libero mollis, quis cursus velit sagittis.
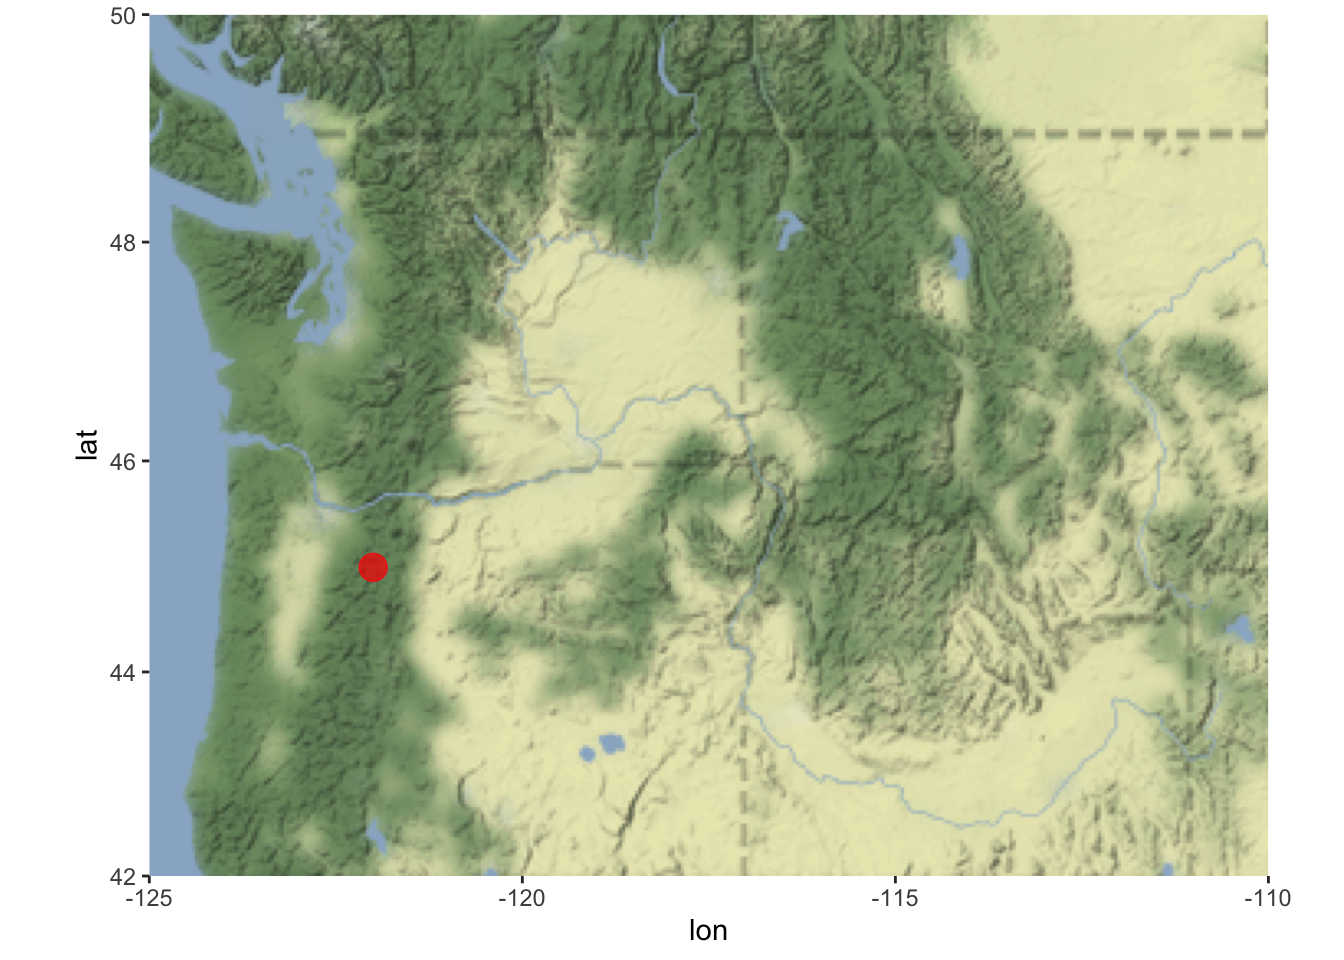
3.1 General location
Morbi iaculis eget augue eget facilisis. Etiam non orci dignissim, efficitur purus viverra, pellentesque neque. Aliquam ornare, magna ut dictum mollis, nunc lorem iaculis nibh, eu consequat lectus urna euismod tortor.
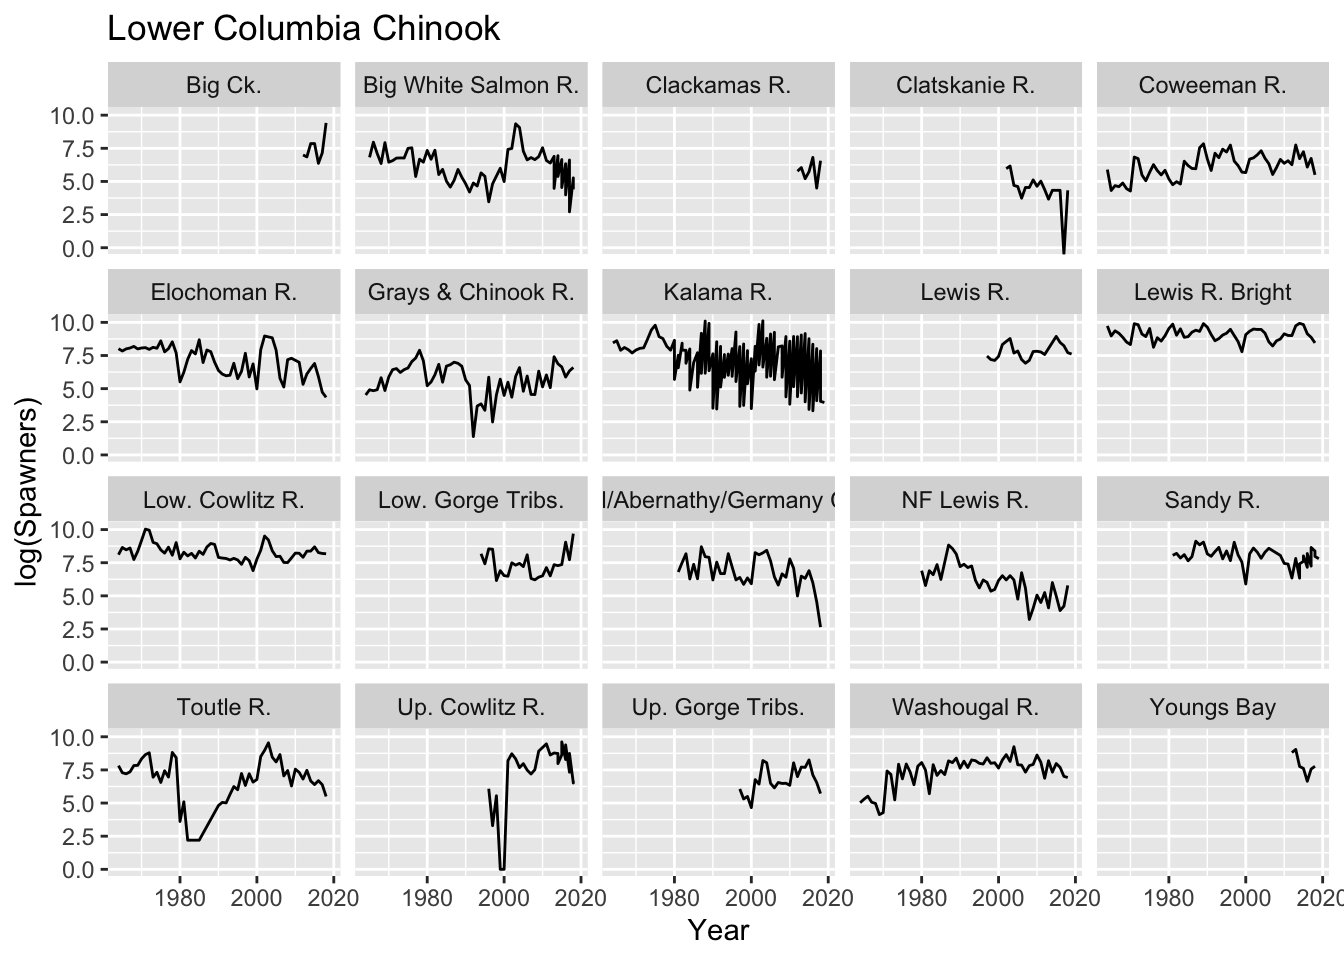
3.2 Recent trends
Lorem ipsum dolor sit amet, consectetur adipiscing elit. Donec vitae ante quis dui egestas fringilla ac vitae justo. Pellentesque quis magna vel odio malesuada rutrum a volutpat nisl. Aliquam fermentum, urna eget tristique mattis, augue augue tristique ipsum, eget finibus nunc eros non nisi. Phasellus mattis hendrerit sapien, quis accumsan dui pretium eget. Nunc eleifend laoreet urna a luctus. Nulla vel sapien in nulla gravida tempus sit amet a metus. Vivamus porta condimentum tempus. Maecenas rhoncus elit id ultricies scelerisque. In gravida urna in ligula fringilla euismod. Curabitur efficitur porta libero ac fermentum. Cras fringilla et libero at posuere. Curabitur sodales dapibus elit a convallis.
Morbi iaculis eget augue eget facilisis. Etiam non orci dignissim, efficitur purus viverra, pellentesque neque. Aliquam ornare, magna ut dictum mollis, nunc lorem iaculis nibh, eu consequat lectus urna euismod tortor. Etiam ut felis nisl. Nunc quis euismod felis. Vestibulum gravida nisi mi, quis mollis velit ullamcorper non. Aliquam tempus fringilla bibendum. Lorem ipsum dolor sit amet, consectetur adipiscing elit. Fusce viverra nulla elementum libero mollis, quis cursus velit sagittis.
3.3 Population raw data
Morbi iaculis eget augue eget facilisis. Etiam non orci dignissim, efficitur purus viverra, pellentesque neque. Aliquam ornare, magna ut dictum mollis, nunc lorem iaculis nibh, eu consequat lectus urna euismod tortor. Etiam ut felis nisl. Nunc quis euismod felis. Vestibulum gravida nisi mi, quis mollis velit ullamcorper non. Aliquam tempus fringilla bibendum. Lorem ipsum dolor sit amet, consectetur adipiscing elit. Fusce viverra nulla elementum libero mollis, quis cursus velit sagittis.
3.3.1 Grays & Chinook R.
Year | Spawners | Fracwild |
2000 | 89 | -99.000 |
2001 | 241 | -99.000 |
2002 | 78 | -99.000 |
2003 | 373 | -99.000 |
2004 | 726 | -99.000 |
2005 | 122 | -99.000 |
2006 | 383 | -99.000 |
2007 | 96 | -99.000 |
2008 | 95 | 0.347 |
2009 | 555 | 0.378 |
2010 | 170 | 0.486 |
2011 | 416 | 0.149 |
2012 | 160 | 0.219 |
2013 | 1,644 | 0.055 |
2014 | 969 | 0.191 |
2015 | 762 | 0.289 |
2016 | 356 | 0.226 |
2017 | 565 | 0.523 |
2018 | 734 | 0.702 |
** data file: LCchinook.csv mod date: Wed Aug 10 17:57:25 2022 -0600 | ||
* These spawner counts are from river redd surveys. | ||
flextable | ||
3.3.2 Youngs Bay
Year | Spawners | Fracwild |
2012 | 6,686 | 0.025 |
2013 | 8,485 | 0.048 |
2014 | 2,345 | 0.051 |
2015 | 2,026 | 0.189 |
2016 | 768 | 0.243 |
2017 | 1,927 | 0.097 |
2018 | 2,383 | 0.014 |
** data file: LCchinook.csv mod date: Wed Aug 10 17:57:25 2022 -0600 | ||
* These spawner counts are from river redd surveys. | ||
flextable | ||
3.3.3 Big Ck.
Year | Spawners | Fracwild |
2012 | 1,096 | 0.050 |
2013 | 946 | 0.000 |
2014 | 2,583 | 0.016 |
2015 | 2,586 | 0.000 |
2016 | 582 | 0.077 |
2017 | 1,279 | 0.000 |
2018 | 12,301 | 0.009 |
** data file: LCchinook.csv mod date: Wed Aug 10 17:57:25 2022 -0600 | ||
* These spawner counts are from river redd surveys. | ||
flextable | ||
3.3.4 Elochoman R.
Year | Spawners | Fracwild |
2000 | 146 | -99.000 |
2001 | 2,806 | -99.000 |
2002 | 7,893 | -99.000 |
2003 | 7,348 | -99.000 |
2004 | 6,880 | -99.000 |
2005 | 2,699 | -99.000 |
2006 | 324 | -99.000 |
2007 | 168 | -99.000 |
2008 | 1,320 | -99.000 |
2009 | 1,467 | -99.000 |
2010 | 1,260 | 0.108 |
2011 | 1,083 | 0.058 |
2012 | 206 | 0.301 |
2013 | 448 | 0.178 |
2014 | 680 | 0.220 |
2015 | 989 | 0.237 |
2016 | 368 | 0.249 |
2017 | 114 | 0.677 |
2018 | 77 | 0.643 |
** data file: LCchinook.csv mod date: Wed Aug 10 17:57:25 2022 -0600 | ||
* These spawner counts are from river redd surveys. | ||
flextable | ||
3.3.5 Clatskanie R.
Year | Spawners | Fracwild |
2002 | 389 | 0.10 |
2003 | 475 | 0.10 |
2004 | 110 | 0.10 |
2005 | 101 | 0.10 |
2006 | 42 | 0.10 |
2007 | 94 | 0.10 |
2008 | 94 | 0.10 |
2009 | 167 | 0.56 |
2010 | 103 | 0.12 |
2011 | 152 | 0.08 |
2012 | 80 | 0.10 |
2013 | 39 | 0.08 |
2014 | 76 | 0.09 |
2015 | 76 | 0.09 |
2016 | 76 | 0.06 |
2017 | 0 | -99.00 |
2018 | 76 | 0.01 |
** data file: LCchinook.csv mod date: Wed Aug 10 17:57:25 2022 -0600 | ||
* These spawner counts are from river redd surveys. | ||
flextable | ||
3.3.6 Mill/Abernathy/Germany Ck.
Year | Spawners | Fracwild |
2000 | 370 | -99.000 |
2001 | 3,860 | -99.000 |
2002 | 3,299 | -99.000 |
2003 | 3,792 | -99.000 |
2004 | 4,611 | -99.000 |
2005 | 2,066 | -99.000 |
2006 | 622 | -99.000 |
2007 | 335 | -99.000 |
2008 | 780 | -99.000 |
2009 | 604 | -99.000 |
2010 | 2,410 | 0.065 |
2011 | 1,192 | 0.079 |
2012 | 147 | 0.143 |
2013 | 657 | 0.194 |
2014 | 554 | 0.062 |
2015 | 989 | 0.081 |
2016 | 397 | 0.219 |
2017 | 95 | 0.174 |
2018 | 14 | 0.394 |
** data file: LCchinook.csv mod date: Wed Aug 10 17:57:25 2022 -0600 | ||
* These spawner counts are from river redd surveys. | ||
flextable | ||
3.3.7 Low. Cowlitz R.
Year | Spawners | Fracwild |
2000 | 2,363 | -99.000 |
2001 | 4,652 | -99.000 |
2002 | 13,514 | -99.000 |
2003 | 10,048 | -99.000 |
2004 | 4,466 | -99.000 |
2005 | 2,870 | -99.000 |
2006 | 2,944 | -99.000 |
2007 | 1,847 | -99.000 |
2008 | 1,828 | -99.000 |
2009 | 2,602 | -99.000 |
2010 | 3,734 | 0.683 |
2011 | 3,685 | 0.745 |
2012 | 2,725 | 0.570 |
2013 | 4,320 | 0.805 |
2014 | 4,347 | 0.672 |
2015 | 5,981 | 0.700 |
2016 | 3,885 | 0.741 |
2017 | 3,630 | 0.806 |
2018 | 3,553 | 0.845 |
** data file: LCchinook.csv mod date: Wed Aug 10 17:57:25 2022 -0600 | ||
* These spawner counts are from river redd surveys. | ||
flextable | ||
3.3.8 Coweeman R.
Year | Spawners | Fracwild |
2000 | 290 | -99.000 |
2001 | 802 | -99.000 |
2002 | 877 | -99.000 |
2003 | 1,106 | -99.000 |
2004 | 1,503 | -99.000 |
2005 | 853 | -99.000 |
2006 | 566 | -99.000 |
2007 | 251 | -99.000 |
2008 | 424 | -99.000 |
2009 | 783 | -99.000 |
2010 | 584 | 0.707 |
2011 | 707 | 0.881 |
2012 | 526 | 0.882 |
2013 | 2,322 | 0.675 |
2014 | 830 | 0.957 |
2015 | 1,391 | 0.977 |
2016 | 439 | 0.936 |
2017 | 841 | 0.857 |
2018 | 244 | 0.884 |
** data file: LCchinook.csv mod date: Wed Aug 10 17:57:25 2022 -0600 | ||
* These spawner counts are from river redd surveys. | ||
flextable | ||
3.3.9 Toutle R.
Year | Spawners | Fracwild |
2000 | 879 | -99.000 |
2001 | 4,971 | -99.000 |
2002 | 7,896 | -99.000 |
2003 | 13,943 | -99.000 |
2004 | 4,711 | -99.000 |
2005 | 3,303 | -99.000 |
2006 | 5,752 | -99.000 |
2007 | 1,149 | -99.000 |
2008 | 1,725 | -99.000 |
2009 | 539 | -99.000 |
2010 | 1,917 | 0.119 |
2011 | 1,498 | 0.132 |
2012 | 907 | 0.259 |
2013 | 1,754 | 0.521 |
2014 | 783 | 0.514 |
2015 | 598 | 0.632 |
2016 | 803 | 0.461 |
2017 | 594 | 0.529 |
2018 | 244 | 0.571 |
** data file: LCchinook.csv mod date: Wed Aug 10 17:57:25 2022 -0600 | ||
* These spawner counts are from river redd surveys. | ||
flextable | ||
3.3.10 Up. Cowlitz R.
Year | Spawners | Fracwild |
2000 | 1 | -99.000 |
2001 | 3,646 | -99.000 |
2002 | 6,113 | -99.000 |
2003 | 4,165 | -99.000 |
2004 | 2,145 | -99.000 |
2005 | 2,901 | -99.000 |
2006 | 1,782 | -99.000 |
2007 | 1,325 | -99.000 |
2008 | 1,845 | -99.000 |
2009 | 7,491 | -99.000 |
2010 | 9,808 | 0.215 |
2011 | 12,914 | 0.330 |
2012 | 5,564 | 0.350 |
2013 | 6,488 | 0.505 |
2014 | 6,231 | 0.363 |
2015 | 5,647 | 0.598 |
2016 | 3,959 | 0.774 |
2017 | 1,520 | 0.983 |
2018 | 674 | 0.923 |
2014 | 2,915 | 0.078 |
2015 | 14,981 | 0.012 |
2016 | 11,946 | 0.017 |
2017 | 6,260 | 0.024 |
2018 | 779 | 0.198 |
** data file: LCchinook.csv mod date: Wed Aug 10 17:57:25 2022 -0600 | ||
* These spawner counts are from river redd surveys. | ||
flextable | ||
3.3.11 Kalama R.
Year | Spawners | Fracwild |
2000 | 1,420 | -99.000 |
2001 | 3,613 | -99.000 |
2002 | 18,809 | -99.000 |
2003 | 24,710 | -99.000 |
2004 | 6,612 | -99.000 |
2005 | 9,168 | -99.000 |
2006 | 10,386 | -99.000 |
2007 | 3,296 | -99.000 |
2008 | 3,734 | -99.000 |
2009 | 7,546 | -99.000 |
2010 | 5,315 | 0.112 |
2011 | 7,591 | 0.056 |
2012 | 7,477 | 0.039 |
2013 | 8,487 | 0.096 |
2014 | 9,451 | 0.081 |
2015 | 6,423 | 0.451 |
2016 | 4,226 | 0.602 |
2017 | 3,041 | 0.570 |
2018 | 2,548 | 0.647 |
2000 | 33 | -99.000 |
2001 | 555 | -99.000 |
2002 | 886 | -99.000 |
2003 | 756 | -99.000 |
2004 | 352 | -99.000 |
2005 | 380 | -99.000 |
2006 | 292 | -99.000 |
2007 | 3,469 | 0.011 |
2008 | 352 | 0.168 |
2009 | 80 | 1.000 |
2010 | 46 | 1.000 |
2011 | 172 | 1.000 |
2012 | 81 | 1.000 |
2013 | 107 | 1.000 |
2014 | 55 | 1.000 |
2015 | 31 | 1.000 |
2016 | 28 | 1.000 |
2017 | 60 | 1.000 |
2018 | 57 | 1.000 |
2019 | 52 | 1.000 |
** data file: LCchinook.csv mod date: Wed Aug 10 17:57:25 2022 -0600 | ||
* These spawner counts are from river redd surveys. | ||
flextable | ||
3.3.12 Lewis R.
Year | Spawners | Fracwild |
2000 | 1,689 | -99.000 |
2001 | 4,132 | -99.000 |
2002 | 5,224 | -99.000 |
2003 | 6,518 | -99.000 |
2004 | 2,171 | -99.000 |
2005 | 2,536 | -99.000 |
2006 | 1,332 | -99.000 |
2007 | 1,012 | -99.000 |
2008 | 1,256 | -99.000 |
2009 | 2,437 | -99.000 |
2010 | 2,490 | 0.640 |
2011 | 2,364 | 0.707 |
2012 | 1,950 | 0.677 |
2015 | 7,653 | 0.453 |
2016 | 4,854 | 0.456 |
2017 | 3,781 | 0.527 |
2018 | 2,243 | 0.633 |
2019 | 2,020 | 0.735 |
** data file: LCchinook.csv mod date: Wed Aug 10 17:57:25 2022 -0600 | ||
* These spawner counts are from river redd surveys. | ||
flextable | ||
3.3.13 Sandy R.
Year | Spawners | Fracwild |
2009 | 3,128 | -99.000 |
2010 | 1,713 | -99.000 |
2011 | 1,635 | -99.000 |
2012 | 570 | -99.000 |
2013 | 2,489 | -99.000 |
2014 | 565 | -99.000 |
2015 | 2,006 | -99.000 |
2016 | 1,281 | -99.000 |
2017 | 1,403 | -99.000 |
2018 | 4,347 | -99.000 |
2019 | 2,449 | -99.000 |
2000 | 363 | 0.237 |
2001 | 3,510 | 0.237 |
2002 | 5,463 | 0.237 |
2003 | 3,993 | 0.237 |
2004 | 2,524 | 0.237 |
2005 | 3,998 | 0.237 |
2006 | 5,359 | 0.237 |
2013 | 2,413 | 0.907 |
2014 | 1,658 | 0.871 |
2015 | 3,023 | 0.885 |
2016 | 3,615 | 0.952 |
2017 | 5,706 | 0.915 |
2018 | 2,900 | 0.913 |
** data file: LCchinook.csv mod date: Wed Aug 10 17:57:25 2022 -0600 | ||
* These spawner counts are from river redd surveys. | ||
flextable | ||
3.3.14 Clackamas R.
Year | Spawners | Fracwild |
2012 | 321 | 0.187 |
2013 | 422 | 0.924 |
2014 | 183 | 0.694 |
2015 | 308 | 0.623 |
2016 | 910 | 0.781 |
2017 | 90 | 0.378 |
2018 | 709 | 0.949 |
** data file: LCchinook.csv mod date: Wed Aug 10 17:57:25 2022 -0600 | ||
* These spawner counts are from river redd surveys. | ||
flextable | ||
3.3.15 Washougal R.
Year | Spawners | Fracwild |
2000 | 2,078 | -99.000 |
2001 | 3,836 | -99.000 |
2002 | 5,725 | -99.000 |
2003 | 3,440 | -99.000 |
2004 | 10,404 | -99.000 |
2005 | 2,671 | -99.000 |
2006 | 2,600 | -99.000 |
2007 | 1,528 | -99.000 |
2008 | 2,491 | -99.000 |
2009 | 2,741 | -99.000 |
2010 | 5,530 | 0.107 |
2011 | 3,224 | 0.146 |
2012 | 965 | 0.262 |
2013 | 3,612 | 0.331 |
2014 | 1,529 | 0.653 |
2015 | 2,925 | 0.456 |
2016 | 2,198 | 0.400 |
2017 | 1,112 | 0.592 |
2018 | 1,019 | 0.886 |
** data file: LCchinook.csv mod date: Wed Aug 10 17:57:25 2022 -0600 | ||
* These spawner counts are from river redd surveys. | ||
flextable | ||
3.3.16 Lewis R. Bright
Year | Spawners | Fracwild |
2000 | 8,741 | -99 |
2001 | 11,274 | -99 |
2002 | 13,293 | -99 |
2003 | 12,912 | -99 |
2004 | 12,928 | -99 |
2005 | 9,775 | -99 |
2006 | 5,066 | -99 |
2007 | 3,708 | -99 |
2008 | 5,485 | -99 |
2009 | 6,283 | -99 |
2010 | 9,294 | 1 |
2011 | 8,205 | 1 |
2012 | 8,143 | 1 |
2013 | 17,022 | 1 |
2014 | 20,489 | 1 |
2015 | 18,635 | 1 |
2016 | 9,311 | 1 |
2017 | 7,149 | 1 |
2018 | 4,671 | 1 |
** data file: LCchinook.csv mod date: Wed Aug 10 17:57:25 2022 -0600 | ||
* These spawner counts are from river redd surveys. | ||
flextable | ||
3.3.17 NF Lewis R.
Year | Spawners | Fracwild |
2000 | 473 | -99 |
2001 | 678 | -99 |
2002 | 493 | -99 |
2003 | 679 | -99 |
2004 | 494 | -99 |
2005 | 116 | -99 |
2006 | 847 | -99 |
2007 | 264 | -99 |
2008 | 25 | -99 |
2009 | 58 | -99 |
2010 | 157 | -99 |
2011 | 90 | -99 |
2012 | 190 | -99 |
2013 | 60 | -99 |
2014 | 403 | -99 |
2015 | 147 | -99 |
2016 | 49 | -99 |
2017 | 68 | -99 |
2018 | 326 | -99 |
** data file: LCchinook.csv mod date: Wed Aug 10 17:57:25 2022 -0600 | ||
* These spawner counts are from river redd surveys. | ||
flextable | ||
3.3.18 Low. Gorge Tribs.
Year | Spawners | Fracwild |
2000 | 681 | -99.000 |
2001 | 653 | -99.000 |
2002 | 1,796 | -99.000 |
2003 | 1,503 | -99.000 |
2004 | 1,724 | -99.000 |
2005 | 1,346 | -99.000 |
2006 | 3,282 | -99.000 |
2007 | 552 | -99.000 |
2008 | 497 | -99.000 |
2009 | 609 | -99.000 |
2010 | 670 | 0.954 |
2011 | 1,246 | 0.948 |
2012 | 671 | 0.941 |
2013 | 1,554 | 0.782 |
2014 | 1,451 | 0.820 |
2015 | 1,569 | 0.921 |
2016 | 8,514 | 0.968 |
2017 | 2,268 | 0.971 |
2018 | 16,221 | 0.988 |
** data file: LCchinook.csv mod date: Wed Aug 10 17:57:25 2022 -0600 | ||
* These spawner counts are from river redd surveys. | ||
flextable | ||
3.3.19 Up. Gorge Tribs.
Year | Spawners | Fracwild |
2000 | 105 | -99.000 |
2001 | 868 | -99.000 |
2002 | 621 | -99.000 |
2003 | 3,670 | -99.000 |
2004 | 3,099 | -99.000 |
2005 | 656 | -99.000 |
2006 | 466 | -99.000 |
2007 | 701 | -99.000 |
2008 | 651 | -99.000 |
2009 | 661 | -99.000 |
2010 | 565 | 0.781 |
2011 | 3,084 | 0.369 |
2012 | 1,090 | 0.309 |
2013 | 2,239 | 0.272 |
2014 | 2,191 | 0.246 |
2015 | 3,826 | 0.320 |
2016 | 1,231 | 0.442 |
2017 | 697 | 0.826 |
2018 | 303 | 0.716 |
** data file: LCchinook.csv mod date: Wed Aug 10 17:57:25 2022 -0600 | ||
* These spawner counts are from river redd surveys. | ||
flextable | ||
3.3.20 Big White Salmon R.
Year | Spawners | Fracwild |
2000 | 147 | -99.000 |
2001 | 1,668 | -99.000 |
2002 | 1,787 | -99.000 |
2003 | 11,480 | -99.000 |
2004 | 8,691 | -99.000 |
2005 | 1,448 | -99.000 |
2006 | 755 | -99.000 |
2007 | 898 | -99.000 |
2008 | 770 | -99.000 |
2009 | 964 | -99.000 |
2010 | 1,887 | 0.725 |
2011 | 723 | 0.885 |
2012 | 593 | 0.936 |
2013 | 984 | 0.658 |
2014 | 1,034 | 0.775 |
2015 | 773 | 0.485 |
2016 | 565 | 0.680 |
2017 | 747 | 0.538 |
2018 | 194 | 0.568 |
2013 | 88 | 0.170 |
2014 | 217 | 0.097 |
2015 | 94 | 0.160 |
2016 | 54 | 0.111 |
2017 | 15 | 0.333 |
2018 | 82 | 0.110 |
** data file: LCchinook.csv mod date: Wed Aug 10 17:57:25 2022 -0600 | ||
* These spawner counts are from river redd surveys. | ||
flextable | ||